
The Real Cost Per Hire for Restaurant Hourly Employees
By Billy Giordano, Co-Founder, StaffedUp
Former restaurant operator. Built StaffedUp after losing a line cook the night before a Saturday rush showed me exactly how much a single bad-hire cycle costs — in dollars, in manager time, and in sleep.
Last updated: September 2026
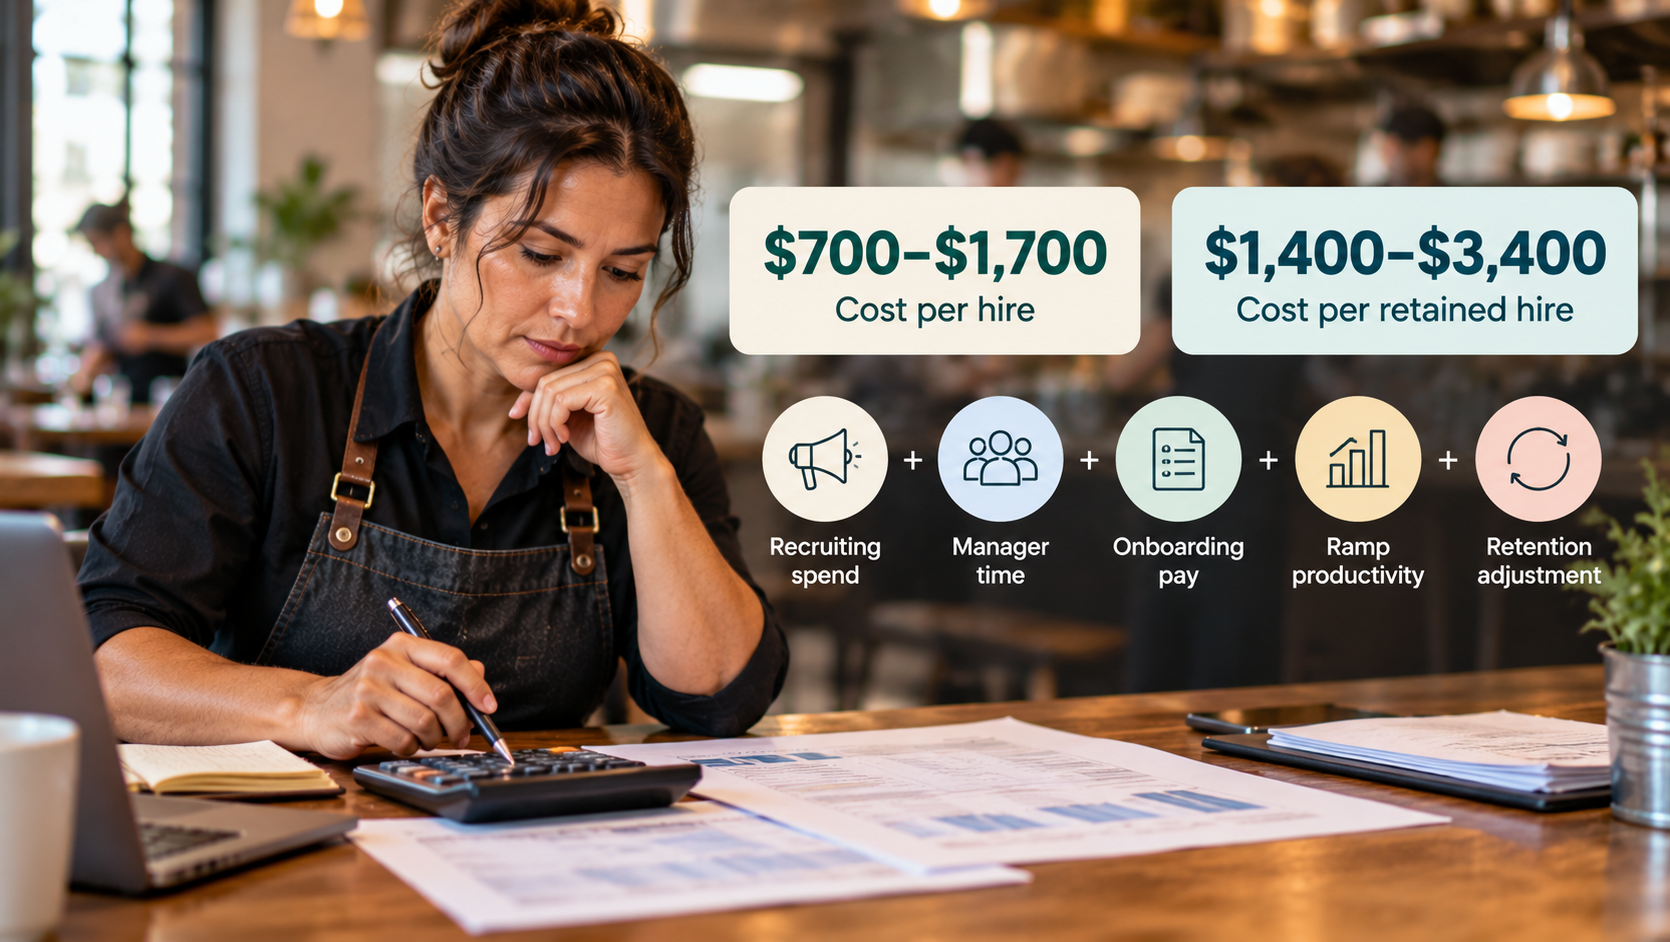
The real cost per hire for a restaurant hourly employee runs $1,400–$3,400 per retained hire once you apply the NRA’s finding that over half of new hires don’t reach 90 days. On a raw component basis — recruiting spend, manager time, onboarding pay, and ramp productivity — each hire event costs $700–$1,700 before attrition adjustment. Here’s how each component breaks down, what the math looks like at your volume, and the one adjustment no other cost-per-hire guide makes for restaurants.
Why Standard Cost-Per-Hire Numbers Miss Restaurant Hiring
Search “cost per hire restaurant” and you’ll find the same cross-industry figures everywhere — SHRM’s widely-cited average of roughly $4,700 per hire, applied as if it describes a line cook in Chicago or a server in Phoenix. It doesn’t. SHRM’s benchmarks measure cost per hire across all industries and role types, including professional services, technology, and executive recruiting — sectors that drive the average up sharply with lengthy approval chains, expensive sourcing, and professional headhunters. Your Saturday dishwasher opening doesn’t resemble that process. The ranges cited online ($1,700 to $15,000+) reflect that methodological chaos: some include vacancy and lost-revenue costs, others count only recruiter fees, and most count nothing because they’re copying each other. When I ran restaurants, nobody handed me a cost-per-hire figure — I just knew replacing a line cook felt expensive. This post builds the model from components instead, every input labeled and sourced, so you can adjust for your market, role mix, and manager’s wage.
Your Full Cost Per Hire: The Component Model
Restaurant hiring cost has four real components: recruiting spend, manager time, onboarding pay, and lost productivity during ramp. Most guides ignore two or three — none are optional in an honest number.
Component 1 — Recruiting spend
As of July 2025, Indeed enforces a reported $25/day minimum per sponsored posting (buyer-reported, not an official rate card). Sponsored Jobs run on a CPC model — roughly $0.10 to $5.00 per click, with competitive metro rates running far higher than rural for the same title — so realistic effective cost per application lands at $15–$50 before any screening. A conservative scenario: $25/day × 10 days per open role = ~$250 in recruiting spend per hire event; in a competitive metro, $400 or higher. Free posting is largely gone — Indeed capped free posts at three per month in December 2025, and organic visibility for single-source feeds ended March 31, 2026. By market, recruiting spend per open role realistically runs about $75–$250 in rural/small markets, $150–$350 mid-size, and $250–$600+ in competitive metros (buyer-reported 2026 employer data). Honest caveat: at 1–2 non-urgent hires a year, posting organically across multiple boards before committing spend is legitimate — board spend matters most above 6–8 hire events a year.
Component 2 — Manager time
Generic guides wave past this with “6–12 hours of manager time” and never do the arithmetic. BLS OEWS May 2025 puts the mean hourly wage for first-line supervisors of food prep and serving workers (SOC 35-1012) at $22.20 (mean annual $46,180). Apply a 1.25–1.30× burden multiplier for FICA and workers’ comp and the real cost of an hour of that manager’s time runs ~$28 loaded. At 8 hours per hire event (a conservative midpoint of the 6–12 hour range), that’s $224 in manager time; at 12 hours, $336 — eight hours carved out of service, prep, and ordering (writing and posting the job, reviewing applications, phone screens, in-person interviews, reference checks, onboarding coordination). Then the ghosting multiplier: NRA data (citing Paradox) found roughly one-third of candidates who accept an offer drop off before their start date, so you run this cycle about 1.5× per retained start — adjusted manager cost per hire who actually shows up: $336–$504. The line cook I lost before a Saturday rush took me 11 hours to replace — I tracked it once, before I counted the Saturday itself. Screening applicants before they reach your inbox compresses this number directly.
Component 3 — Onboarding and training pay
The legal reality first: all training time is compensable under the FLSA, paid at the employee’s regular rate — no unpaid trial shifts. Employment law varies by state, and tipped-employee training wages involve additional rules, so check your state’s guidelines and DOL FLSA guidance directly; this isn’t legal advice. BLS OOH May 2025 shows the median hourly wage for food prep workers at $16.98 and for food-and-beverage serving workers at $15.24 — use $16/hr as a working figure. At 10 days of paid ramp at ~50% productive output (10 days × 6 hours × $16), that’s $960 in gross wage during ramp, of which the wasted-wage equivalent runs ~$480 per hire event. For BOH hires there’s a layer that never shows in the wage calc: trail food cost — prep and plated dishes discarded during training, a directional operator estimate of $50–$150 per BOH hire (operator-reported, worth tracking in your own kitchen).
Component 4 — Lost productivity during ramp
A new hire isn’t fully productive on day one. FOH hires typically reach full productivity within 2–4 weeks; BOH hires (line cook, prep) take 4–8 weeks by menu complexity — directional estimates from platform observation across thousands of placements, not an external figure. At 60–70% productivity during ramp, a new hire is slower on the line, more likely to send a ticket back wrong, and more likely to need a mid-service question answered. The NRA’s 2026 research shows 59% of operators with difficult-to-fill openings reported higher overtime for existing staff; modeled at 16 days of vacancy × 2 overtime hours/day for one employee × 1.5× rate, that adds $77–$100 to the labor cost of a single vacancy (an illustrative model built from real inputs, not a sourced external figure).

| Cost Component | Low | High | Source / Confidence |
|---|---|---|---|
| Job-board recruiting spend | $150 | $400+ | Buyer-reported 2026 employer data |
| Manager screening/interview time | $224 | $504 | BLS OEWS loaded rate × 8–12 hrs + ghosting |
| Onboarding/training pay (partial output) | $200 | $500 | BLS wage × ramp days; directional |
| BOH trail food cost | $50 | $150 | Operator estimate |
| Overtime coverage during vacancy | $75 | $150 | Illustrative model |
| Subtotal — single hire event | ~$700 | ~$1,700 | Component math |
| Adjusted for ~50% 90-day attrition | ~$1,400 | ~$3,400 | Per retained hire |
| With extended vacancy cost | Well over $2,000 | $4,000+ | Directional |
Composite totals are the product of the component math — not sourced from an external average. Every figure carries its confidence level.
The 90-Day Cliff: Why Your Real Cost Per Retained Hire Is Higher
This is the adjustment no other cost-per-hire page makes. The standard formula counts one hire event — it doesn’t account for hiring, onboarding, absorbing two weeks of ramp cost, and then losing that person by week 8. You paid the full cycle, received partial productivity, and now you’re starting over. NRA data (citing Paradox) found one-third of accepted offers end in pre-start ghosting and over half of new hires don’t reach 90 days (this spans restaurant and non-restaurant firms — restaurant-specific first-90-day attrition tracks higher, consistent with the sector’s 65.5% annual turnover). The adjustment is straightforward: cost per retained hire = component cost ÷ (1 − attrition rate). At 50% attrition that’s 2.0×; at 45%, 1.82×. Applied to the component range, $700–$1,700 × 1.82–2.0 = roughly $1,400–$3,400 per retained hire. What changes the cliff isn’t complicated — structured onboarding, clear day-one expectations, a schedule handed over before the first shift, paperwork done ahead, and manager check-ins in the first two weeks. These are operationally free: process, not spend. For the retention side, see how to reduce restaurant turnover.
The Annual Turnover Tax: What This Costs at Your Volume
The per-hire number is real; the annual number is what hits you in the gut. BLS JOLTS shows accommodation and food services ran 65.5% annual turnover in 2025, and since 2001 the sector has averaged 75.6% — well above the broader economy’s 43.4% over the same period. Single unit: a 20-person hourly crew at 65% turnover generates roughly 13 hire events a year — at $1,400 per retained hire, $18,200/year; at $3,400, $44,200/year, most of it absorbed invisibly in manager hours, overtime, and BOH food cost during training. Multi-unit: five units × 20 staff × 65% turnover ≈ 65 hire events a year — at $1,400–$3,400 per retained hire, $91,000–$221,000/year. That’s not a staffing problem, it’s a structural P&L leak that managing hiring across multiple locations only makes clearer. The NRA’s economic indicators add one more line: among operators with difficult-to-fill openings in 2025, 48% reported lost sales directly attributable to understaffing — a cost that appears in no CPH formula and is real anyway. Across StaffedUp postings, operators compress the 16-day average vacancy window: platform data shows 77% shorter time-to-hire, which directly reduces overtime and foregone covers during the fill.
How to Actually Lower Your Cost Per Hire (and When Software Is Worth It)
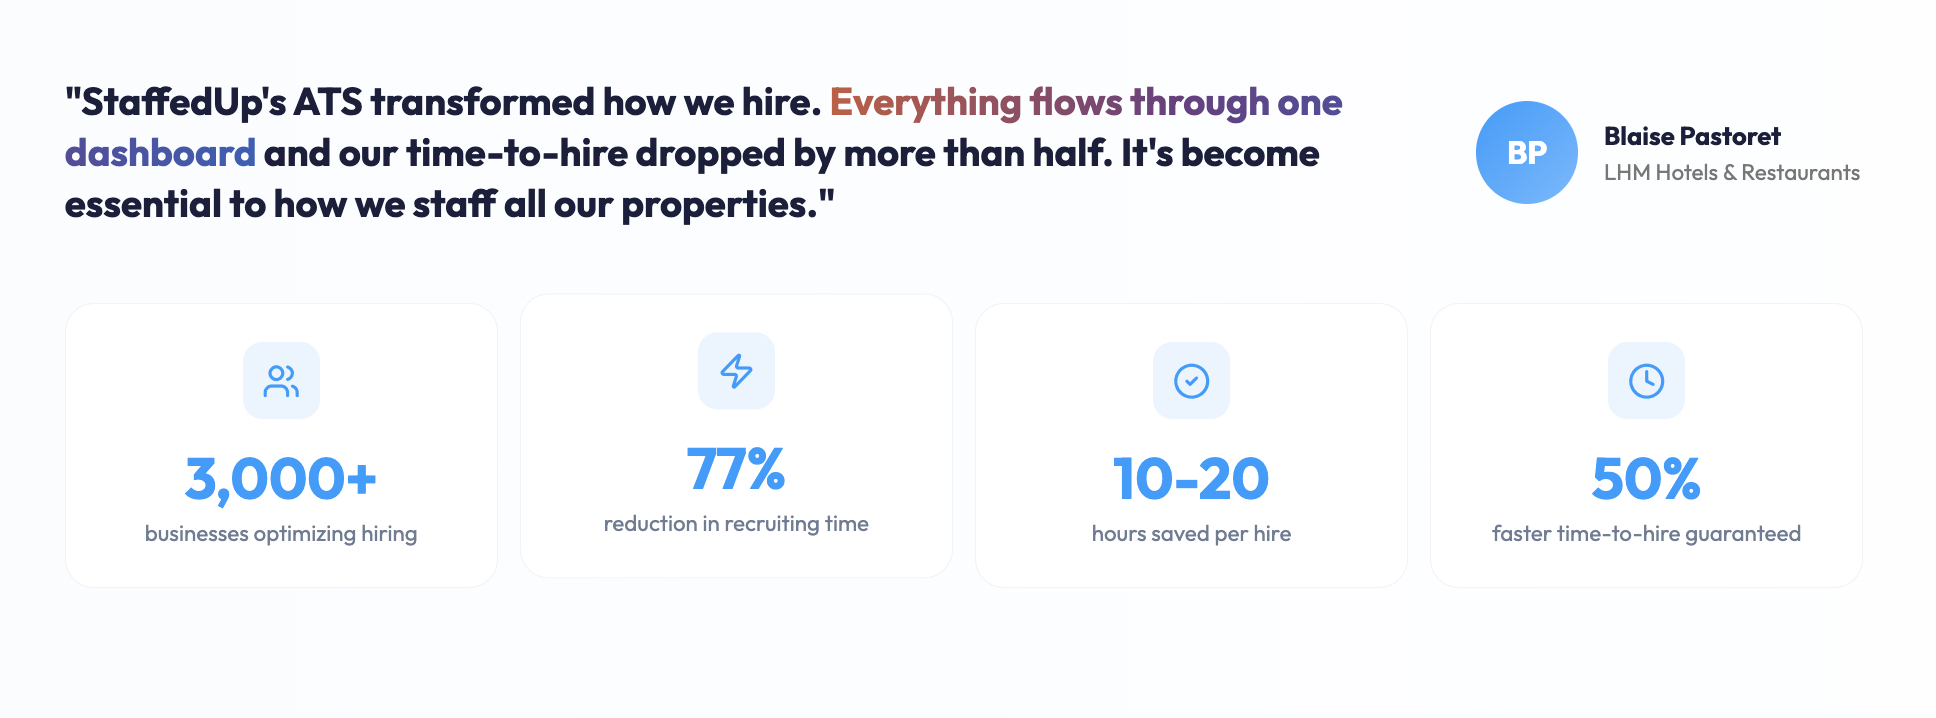
The honest version starts with the operators who don’t need the rest of it: if you’re making 1–3 hires a year, free organic posts across multiple boards are probably sufficient — spreadsheets work. The ROI on hiring software only materializes when you run enough hire events that screening automation and time compression save meaningful manager hours and vacancy days. The levers that actually move cost per hire, ranked by impact: reduce time-to-fill (the NRA’s 16-day average is the target to beat — every vacancy day costs overtime, foregone covers, and manager distraction); improve applicant quality upstream (fewer unqualified applications means less screening time); improve 90-day retention (every retained hire amortizes the cycle cost; every early exit doubles it — process, not spend); and reduce ghosting and no-shows (faster communication between offer and start date). StaffedUp operators see 8x more applicants, 77% shorter time-to-hire, and 45% decreased turnover — the mechanism is post once, distribute to major boards including Monster, screen out unqualified and mass-apply applications, qualified applicants in your inbox — hitting Components 1, 2, and 4 at once. Sean O. runs an Irish Pub & Grill in Chicago; he spent $400/month on Indeed for three months with zero hires, posted on StaffedUp for $1, and had a qualified applicant within 18 hours. At $29/month for unlimited posts, an operator running 13 hire events a year pays about $2.23 per hire event in platform fees, against a component cost of $700–$1,700 for even one event — the math works above the threshold, and only above it. The most expensive outcome of all is a bad fit who stays 90 days and turns out wrong for your kitchen: you absorb the full cycle plus the productivity and morale damage, then restart from zero. That’s why getting screening right upstream matters more than any single cost component.
Post your first job for $1. A qualified applicant in your inbox within 24 hours, or you pay nothing — the charge reverses automatically. Under three minutes from a phone, no contract, no setup call. After the first post, it’s $29/month for unlimited active posts.
Frequently Asked Questions
What is the average cost per hire for a restaurant employee?
There’s no single correct answer — it depends on which components you include. On a component basis (recruiting spend, manager time, onboarding pay, lost productivity), replacing one hourly restaurant employee typically costs $700–$1,700 per hire event. Adjusted for the NRA finding that over half of new hires don’t reach 90 days, cost per retained hire runs $1,400–$3,400. Cross-industry benchmarks like SHRM’s don’t adjust for restaurant wage rates, manager cost structures, or the sector’s turnover, so applying them to a line cook produces a misleading number.
How do you calculate cost per hire for hourly restaurant workers?
Add four components: recruiting spend (job-board cost per open role, typically $150–$400+); manager time (hours screening and interviewing × the loaded hourly rate); onboarding pay (training hours at reduced productivity); and lost productivity plus overtime during vacancy and ramp. Then divide by your 90-day retention rate to get cost per retained hire. Show all assumptions — the right number varies by market, role, and how many of your hires stay past 90 days.
What does restaurant employee turnover really cost annually?
BLS JOLTS shows accommodation and food services ran 65.5% annual turnover in 2025. At a conservative $1,400 per retained hire, a 20-person restaurant making 13 hires a year spends roughly $18,200 annually on turnover-driven hiring — most of it invisible on the P&L, absorbed in manager hours, overtime, and BOH food cost during training. The NRA also found 48% of operators with difficult-to-fill openings reported lost sales directly attributable to understaffing.
How many hours does it take a manager to hire one restaurant employee?
Industry data puts manager screening and interview time at 6–12 hours per hire event — writing and posting the job, reviewing applications, phone screens, in-person interviews, reference checks, and onboarding coordination. At the BLS OEWS May 2025 mean wage for first-line supervisors of food prep and serving workers ($22.20/hr) with a standard burden multiplier, 8 hours costs about $224 in loaded labor. With roughly one-third of accepted offers ending in pre-start ghosting, the effective manager cost per retained start rises to $336–$504.
What is the restaurant industry’s current hourly turnover rate?
The accommodation and food services sector’s annual turnover rate was 65.5% in 2025, per BLS JOLTS. Since 2001 the sector has averaged 75.6% — substantially higher than the broader economy’s 43.4% over the same period. Hourly BOH and FOH roles consistently track at or above the sector average.
Does hiring software actually reduce cost per hire for restaurants?
It depends on hire volume. For operators making 1–3 hires a year, free organic posts across multiple boards are often sufficient — software won’t pencil out at that volume. Above 8–10 hire events a year, the ROI becomes real: compressed time-to-fill cuts vacancy cost, better screening cuts manager time, and improved fit cuts early attrition. StaffedUp operators report 77% shorter time-to-hire and 45% decreased turnover. The first post is $1 — a qualified applicant in your inbox within 24 hours or you pay nothing, the charge reverses automatically.
Sources
- U.S. Bureau of Labor Statistics, OEWS May 2025, Table 1 — Food Preparation and Serving Occupations (first-line supervisors 35-1012: $22.20/hr mean, $46,180 mean annual).
- U.S. Bureau of Labor Statistics, OOH — Food Preparation Workers ($16.98 median) and Food and Beverage Serving Workers ($15.24 median).
- U.S. Bureau of Labor Statistics, JOLTS — accommodation and food services turnover 65.5% (2025); long-run average 75.6%.
- National Restaurant Association — 2026 Research Insights on hiring and staffing (16-day average time-to-fill; 59% higher overtime; ghosting and 90-day attrition, citing Paradox) and Economic Indicators (48% reported lost sales from understaffing).
- U.S. Department of Labor, Wage and Hour Division — FLSA (training-time compensability). SHRM cross-industry cost-per-hire cited for contrast only.
- StaffedUp platform data: 8x more applicants, 77% shorter time-to-hire, 45% decreased turnover — internal aggregate.

Hire Smarter, Faster
StaffedUp simplifies hiring for restaurant & hospitality operators. Post your first job for $1.